
Personal Finance Big Ideas taught in this task:
TASK
Your teacher was just awarded $1,000 to spend on materials for your classroom. She asked all 20 of her students in the class to help her decide how to spend the money. Think about which supplies will benefit the class the most.
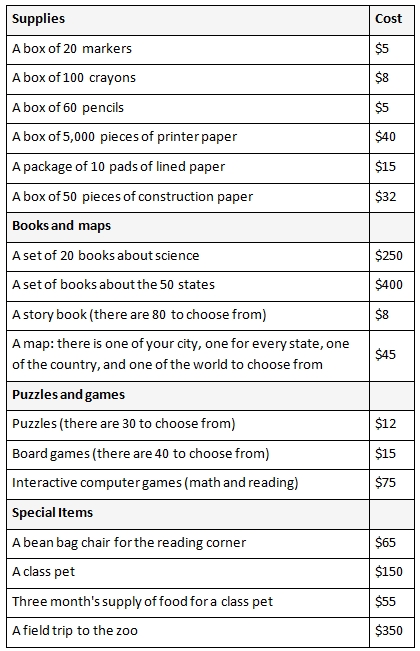
- Write down the different items and how many of each you would choose. Find the total for each category.
- Supplies
- Books and maps
- Puzzles and games
- Special items
- Create a bar graph to represent how you would spend the money. Scale the vertical axis by $100. Write all of the labels.
- What was the total cost of all your choices? Did you have any money left over? If so, how much?
- Compare your choices with a partner. How much more or less did you choose to spend on each category than your partner? How much more or less did you choose to spend in total than your partner?
COMMENTARY
The purpose of this task is for students to “Solve problems involving the four operations” (3.OA.A) and “Draw a scaled picture graph and a scaled bar graph to represent a data set with several categories” (3.MD.3). Additionally, students will engage in MP3, Model with mathematics. In this task students are asked to decide how to spend $1,000 on supplies and materials for their classroom; students will have to make choices and be careful not to exceed the budget. Students are asked to decide which supplies will benefit the class the most and will compare their choices with other students’ choices. Because the budget does not allow students to buy one of everything, this task provides an opportunity for teachers to discuss costs and benefits. A benefit is something that satisfies your wants. A cost is what you give up when you decide to do something.
In third grade students are asked to fluently add and subtract within 1,000 (3.NBT.3) which is why the total budget is $1,000. Students are also multiplying and dividing within 100 (3.OA.7), so they might choose, for example, to buy 20 boxes of markers at $5 each so that there is a box of markers for every student in the class. It is possible that students will choose to purchase a number of one of the items where the total is greater than $100; while students are not expected to be fluent in multiplication above 100, they should be able to use their multiplication strategies to find such products. This task provides students with a natural opportunity to use addition, subtraction, and multiplication, and they might also use division depending on how they approach the task; thus it is well aligned to 3.OA.8.
Bar graphs make it easy for students to compare their allocations. If all of the students in the class include all categories on their graphs (whether they allotted any spending to them or not), list the categories in the same order that they are listed in the data table, and use the same colors for each category on a final draft, the teacher can put all of the final graphs up for display and the class can see whether there is a general consensus for how to spend the $1000 or not.
As an extension, the teacher might consider asking students to represent their total purchases with an equation; for example, if a student chooses 15 boxes of markers, 3 boxes of crayons, and 2 beanbag chairs, she could write:
15×5+3×8+2×65=75+24+65+65=229
This task is part of a set collaboratively developed by Money as You Learn, an initiative inspired by recommendations of the President’s Advisory Council on Financial Capability, and Illustrative Mathematics. Integrating essential financial literacy concepts into the teaching of the Common Core State Standards can strengthen teaching of the Common Core and expose students to knowledge and skills they need to become financially capable young adults. A mapping of essential personal finance concepts and skills against the Common Core State Standards as well as additional tasks and texts will be available at www.moneyasyoulearn.org. This task and additional personal finance-related mathematics tasks are available at www.illustrativemathematics.org and are tagged “financial literacy.”
Resources
SOLUTION
- Solutions will vary. Here is one possible set of choices.
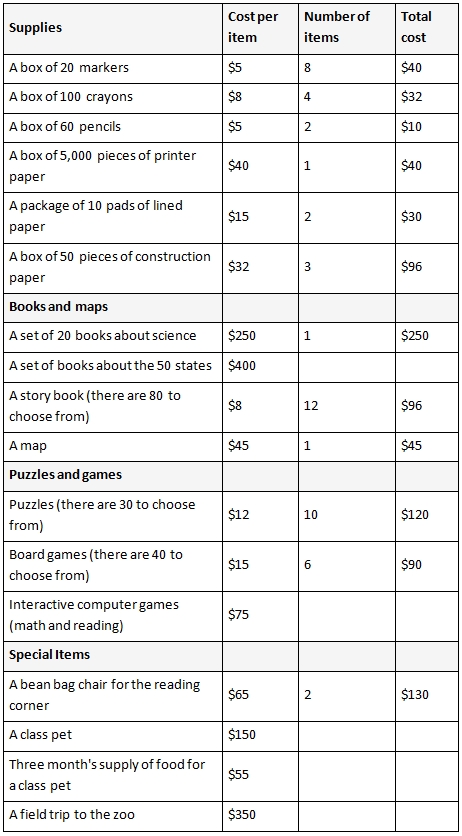
- 8 boxes of markers will cost 8×5=4×2×5=4×10=40 dollars.
4 boxes of crayons will cost 4×8=4×4×2=16×2=10×2+6×2=20+12=32 dollars.
2 boxes of pencils will cost 2×5=10 dollars.
1 box of printer paper costs 40 dollars.
2 packages of lined paper cost 2×15=2×10+2×5=20+10=30 dollars.
3 boxes of construction paper cost 3×32=3×30+3×2=90+6=96 dollars.
The total for the supplies is 40+32+10+40+30+96=248 dollars. - 12 books cost 12×8=10×8+2×8=80+16=96 dollars.
The total cost for the books and maps is 250+96+45=391 dollars. - The total cost for the puzzles and games is
10×12+6×15=120+3×30=120+90=210 dollars. - The total for the special items is 130 dollars.
- 8 boxes of markers will cost 8×5=4×2×5=4×10=40 dollars.
- Here is a bar graph showing these totals:
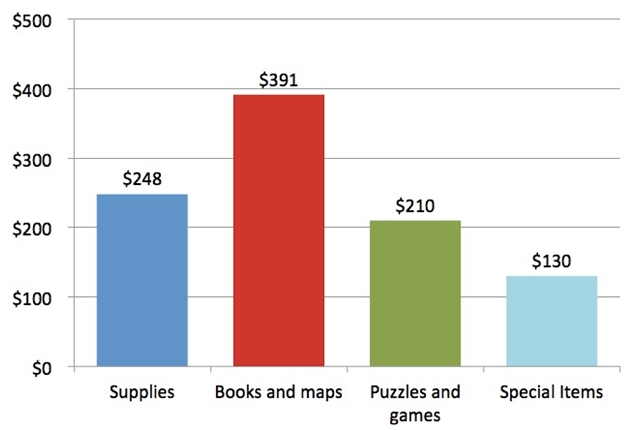
- The total from all the purchases would be 248+391+210+130=979. So these purchases would total $979 and $21 would be left over.
- Comparisons will vary.